

Regular database indexes cannot be used for queries that contain conditions based on two or more ranges. But there are unconventional ways to solve this problem and make queries faster. In this post we’ll explore a conceptually simple way: logical charts.
The Problem
Suppose we need to find the customers in a certain age band who made a certain number of orders in the last 12 months. We have both these values in the same table, and we have an index covering both columns and nothing else. Do you expect the following query to use the index?
SELECT id, email
    FROM customer
    WHERE
        (date_of_birth BETWEEN DATE '1994-01-01' AND DATE '2004-01-01')
        AND (last_year_orders BETWEEN 5 AND 10)
;
Depending on which database you use, there are a few options:
- The index isn’t used at all.
- The index is used for the first column stored in the index, but to read the second the database makes additional reads from the data. Depending on your data distribution, this is probably slower than a full table scan (which is usually slow, unless the table is very small).
- If the first column in the index has lower selectivity than the second, the query execution will be even slower than it should be.
- The whole index is scanned. This is probably as slow as a full table scan, or slightly faster.
Why? A B-Tree index optimises queries because it’s an ordered data structure. But the order of values doesn’t help making a search on multiple ranges. For more information about what a B-Tree can do, see Query Optimisation: Using indexes for WHERE with multiple conditions.
I call queries like this Double-Range Queries.
A Solution: GIS Data
Think of the data in the only way that feels natural for a human: a point chart where the axes represent the date of birth and the number of orders in the last year. The following image, created by Nano Banana 2, represents this way of visualising the data:
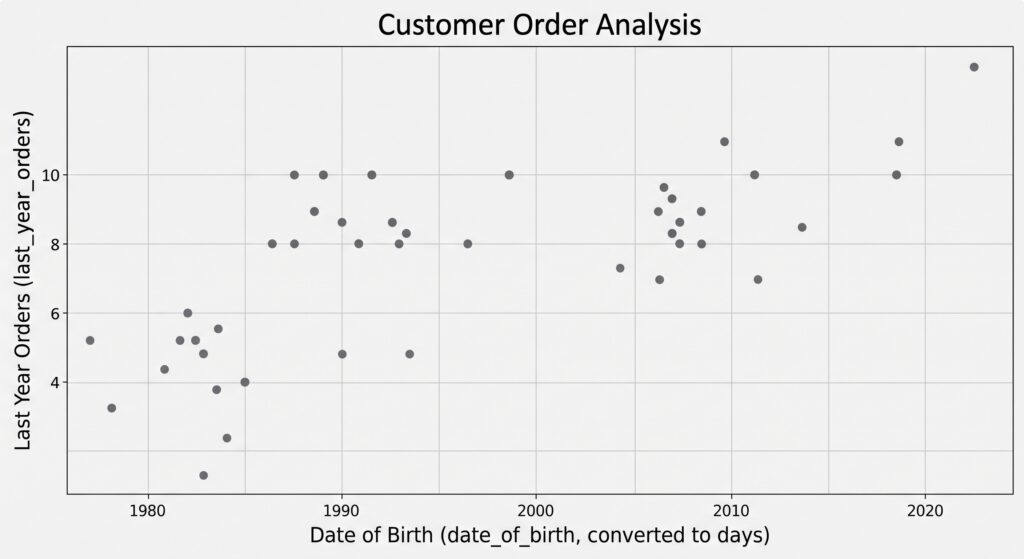
Each point represents a customer, and therefore a point we need to select. Conceptually, to select the right points we only need to draw a rectangle on the chart:
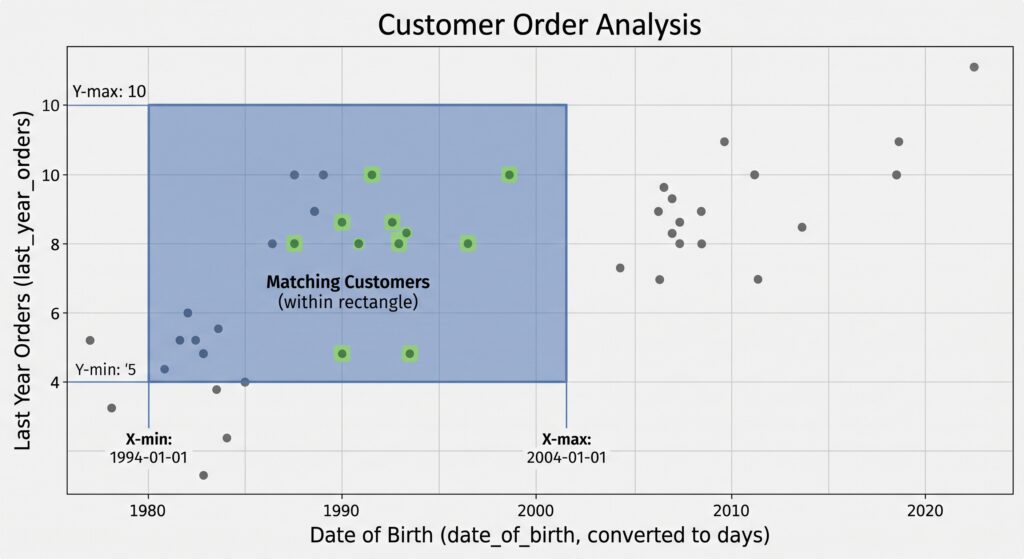
Now the concept should be clear, but we need to write the SQL. Let’s see the table definition, and then comment it:
CREATE TABLE customer (
    id INT AUTO_INCREMENT PRIMARY KEY,
    date_of_birth DATE NOT NULL,
    last_year_orders INT NOT NULL,
    -- ...probably more columns here...
    dob_orders_chart POINT GENERATED ALWAYS AS (
        POINT(TO_DAYS(date_of_birth), last_year_orders)
    ) STORED NOT NULL,
    SPATIAL INDEX sp_idx_dob_orders (dob_orders_chart)
) ENGINE=InnoDB;
Things to note in the above snippet:
- We added a column called
dob_orders_chart. - The new column could have been of
GEOMETRYtype. That would work. But all the values we’re going to have are points, so we choose the more efficientPOINTtype instead. dob_orders_chartis a generated column. This means that when a row is inserted, or one of (date_of_birth,last_year_orders) is updated, a new value fordob_orders_chartis calculated automatically. Users cannot change these values manually.- While
last_year_ordersis anINTEGER,date_of_birthis aDATEand its raw values cannot be used as coordinates for GIS data. The problem is easy to solve:TO_DAYS(date_of_birth)returns anINTEGER, so it’s a valid coordinate. More specifically,TO_DAYS()returns the number of days passed from the beginning of the Gregorian calendar (Friday, 15 October 1582). - We index this column with a
SPATIAL INDEX, which uses an R-Tree data structure. An R-Tree index partitions a space in nested areas with boundaries that depend on data distribution.
Now let’s see the query that will find the desired data from the above table:
SELECT id
    FROM customer
    WHERE MBRWITHIN(
        dob_orders_chart,
        ST_GEOMFROMTEXT(
            CONCAT(
                'POLYGON((',
                    TO_DAYS('1994-01-01'), ' 5, ',
                    TO_DAYS('2004-01-01'), ' 5, ',
                    TO_DAYS('2004-01-01'), ' 10, ',
                    TO_DAYS('1994-01-01'), ' 10, ',
                    TO_DAYS('1994-01-01'), ' 5',
                '))'
            )
        )
    )
;
Things to note about the above query:
MBRWITHIN()can often be described as an approximate function, because MBR stands for Minimum Bounding Rectangle. For example, if you use it with a circle, it will return all points that are contained in the smallest square that can contain the circle – not just the circle itself. But in our case it’s used with a rectangle that is aligned with the space axis, so this function will return precise results.ST_GEOMFROMTEXT()accepts a text representation of a geometric shape and its coordinates. To build this representation, we can useCONCAT().- We have 5 coordinates, and that is intended. The last coordinate matches the first, and it’s there to close the shape.
To concatenate strings, we can also use SFORMAT():
ST_PolyFromText(
    SFORMAT(
        'POLYGON(({0} {1}, {2} {1}, {2} {3}, {0} {3}, {0} {1}))',
        TO_DAYS('1994-01-01'),
        5,
        TO_DAYS('2004-01-01'),
        10
    )
)
These syntaxes are equivalent. Just use the one that you and your team find easier to understand. For more details, see How to compose strings in MariaDB.
Multi-Dimensional Charts
Most databases, including MariaDB and MySQL, can’t deal with multi-dimensional geospatial data.
Up to 4 Dimensions on PostgreSQL
PostgreSQL users are luckier here: PostGIS supports multi-dimensional data, and can include up to 4 dimensions in a GiST index, thanks to the idx_spatial_nd operator class. The syntax to use for creating such an index is the following:
CREATE INDEX idx_spatial_nd
    ON customer_3d
    USING GIST (geom gist_geometry_ops_nd)
;
PostGIS doesn’t require us to specify the list of columns to index.
More Than 3 Dimensions on Other Databases
If we have more than two range conditions and we use a database that limits spatial indexes to 2 dimensions (or doesn’t support GIS at all), we need to find an alternative solution.
In several cases, you can come up with a math expression that turns the columns you need to search into a single score of type INTEGER or FLOAT. However, this is beyond the scope of this article. If you want me to cover this topic in a future article, leave a comment here.
Conclusions
We’ve discussed the type of queries I call Double-Range queries and why they can’t make an optimal use of a B-Tree index. We’ve seen a solution that works well in most cases. Our example even covers the case when one of the ranges is a date. I have briefly mentioned which solutions exist for queries with more than two ranges – this might be a topic for a future article.
Federico Razzoli





0 Comments